Everything a subcontractor needs to see the money on a job, and nothing else.
No scheduling module, no client portal, no selections. Project Financials does the finance half of a construction suite, deeply, so the people who already know the numbers can put them in.
Projects and draws, with retention done right
A project is a contract, a start and end date, a PM and a retention rate. Each pay-app draw records what you billed, what was held, when it was submitted and when it got paid. The app computes net due, days outstanding and the retention balance, and flags draws past your overdue threshold.
- Awarded, pipeline (with probability) and closed statuses
- Draw-by-draw retention held and released
- Overdue badges based on your payment terms
- Remaining to bill and retention held on every project header
Change orders that move the contract only when approved
Log a change order the day you price it. Pending COs stay visible on the project and in the company totals so nobody forgets them, but only approved COs adjust the contract value that the WIP schedule and the forecast run on.
- Additions and deductions, with running net change
- Company-wide CO totals on the dashboard
- History kept for the audit log on Business
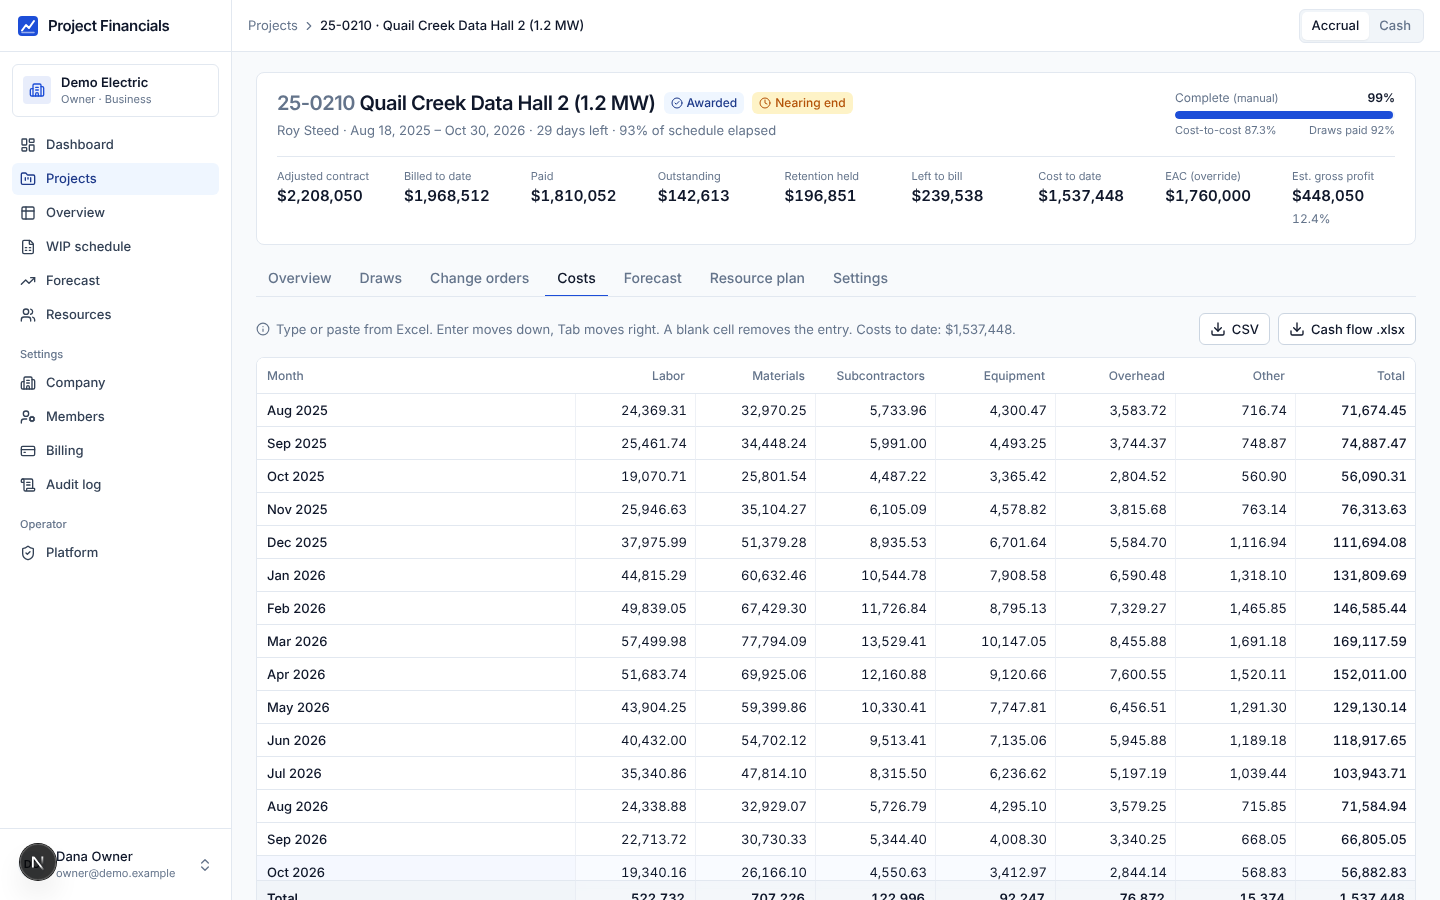
Costs by month and category, pasted straight from Excel
A grid of months by category: labor, materials, subcontractors, equipment, overhead and other, or the categories you define. Type into it or paste a block from your accounting export. Totals, cost to date and cost-to-cost percent complete update as you go.
- Paste from Excel, tab and enter move like a spreadsheet
- Your own category list per company
- Bulk cost import on Professional and above
Cash-flow curves, accrual or cash basis
Every project and the whole company get a monthly inflow, outflow, net and cumulative view. On accrual basis a draw counts when it is submitted; on cash basis it counts when it is paid and retention sits out until it is released. Flip between them with one toggle in the top bar.
- Actual months plus forecast months, hatched so you can tell them apart
- Reserve line from your company settings
- Cumulative net and the month it bottoms out
PM forecasting: cost-to-complete by the person who knows
The project manager owns the forecast for their jobs. Past months fill in from actual draws and costs. For the months ahead the PM types the inflow and outflow they expect; any month they leave alone is spread evenly to the end date. Each number carries its source so the office can see what was typed, what was measured, and what was assumed.
- Per-project EAC override and percent complete
- Forecast margin vs original estimate, with profit-fade flags
- Trend overlay from the last three actual months
| Month | Inflow | Outflow | Source |
|---|---|---|---|
| Oct 2026 | $244,053 | $186,900 | actual |
| Nov 2026 | $260,000 | $201,000 | manual |
| Dec 2026 | $265,000 | $195,000 | manual |
| Jan 2027 | $272,180 | $188,300 | auto |
| Feb 2027 | $188,400 | $140,200 | auto |
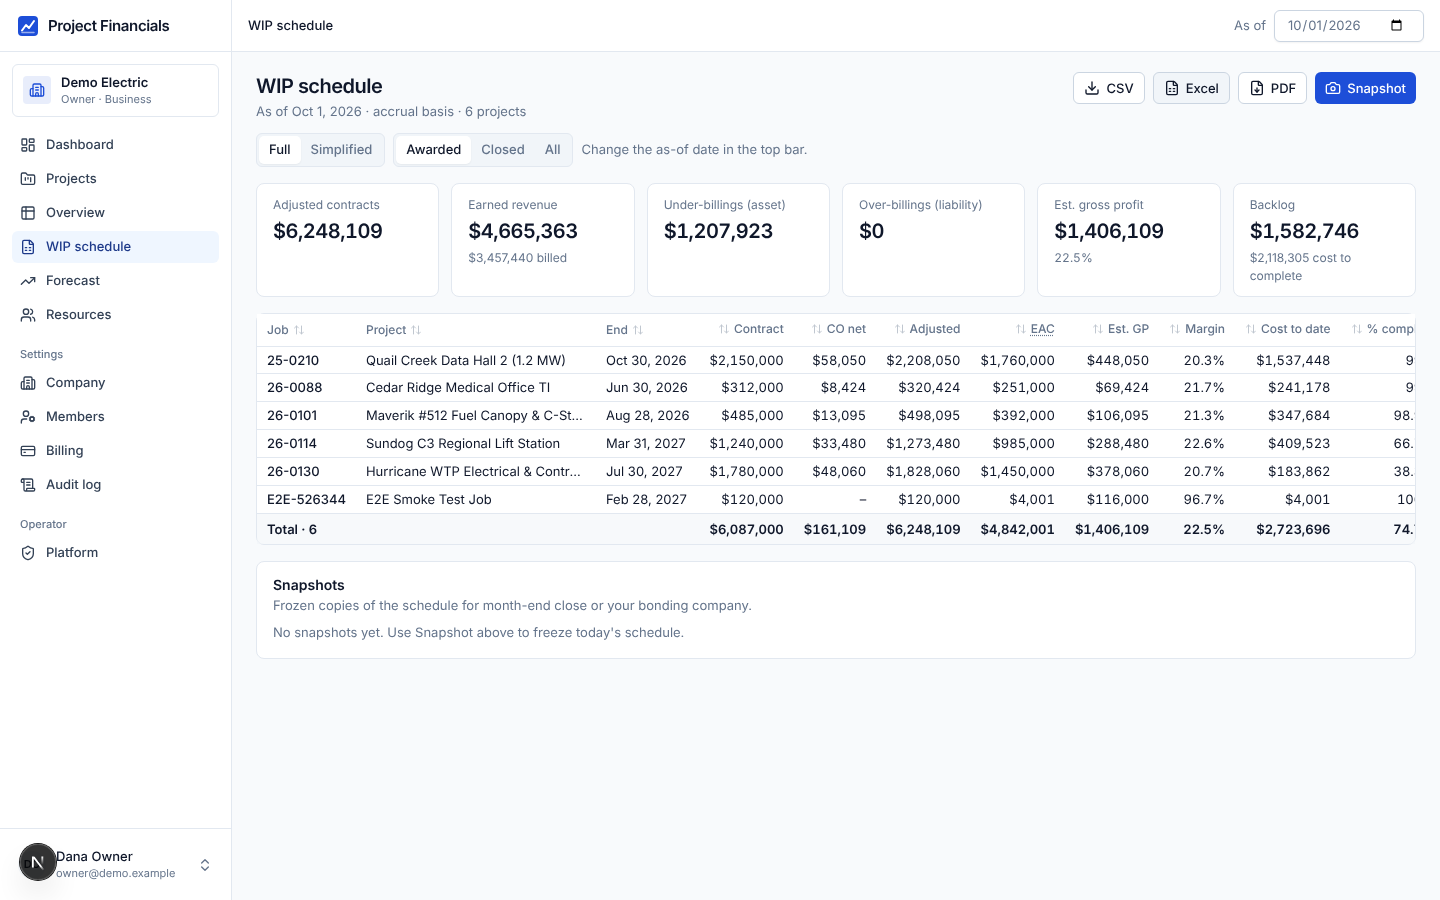
A full WIP schedule for your bonding agent
Pick an as-of date and the schedule is rebuilt from the draws and costs on file: contract, approved COs, adjusted contract, estimated cost at completion, estimated gross profit, cost to date, percent complete, earned revenue, billed to date, under-billings, over-billings and backlog. Full or simplified, awarded or closed, totals row included.
- Snapshots frozen at month-end for close and for your surety
- Excel and PDF with the as-of date printed on them
- 24 months of history and multi-period comparison on Business
Company dashboard and gauges
Five gauges answer the Sunday-night questions: net cash against reserve, this month's billing against capacity, draws paid, forecast margin against target, and outstanding receivables against capacity. Under them, fifteen months of inflow and outflow with net and cumulative lines, and an in-flight table of every awarded project.
- Include pipeline, weighted by probability, with one switch
- Thresholds you set on Business
- PDF pack for the monthly owner meeting
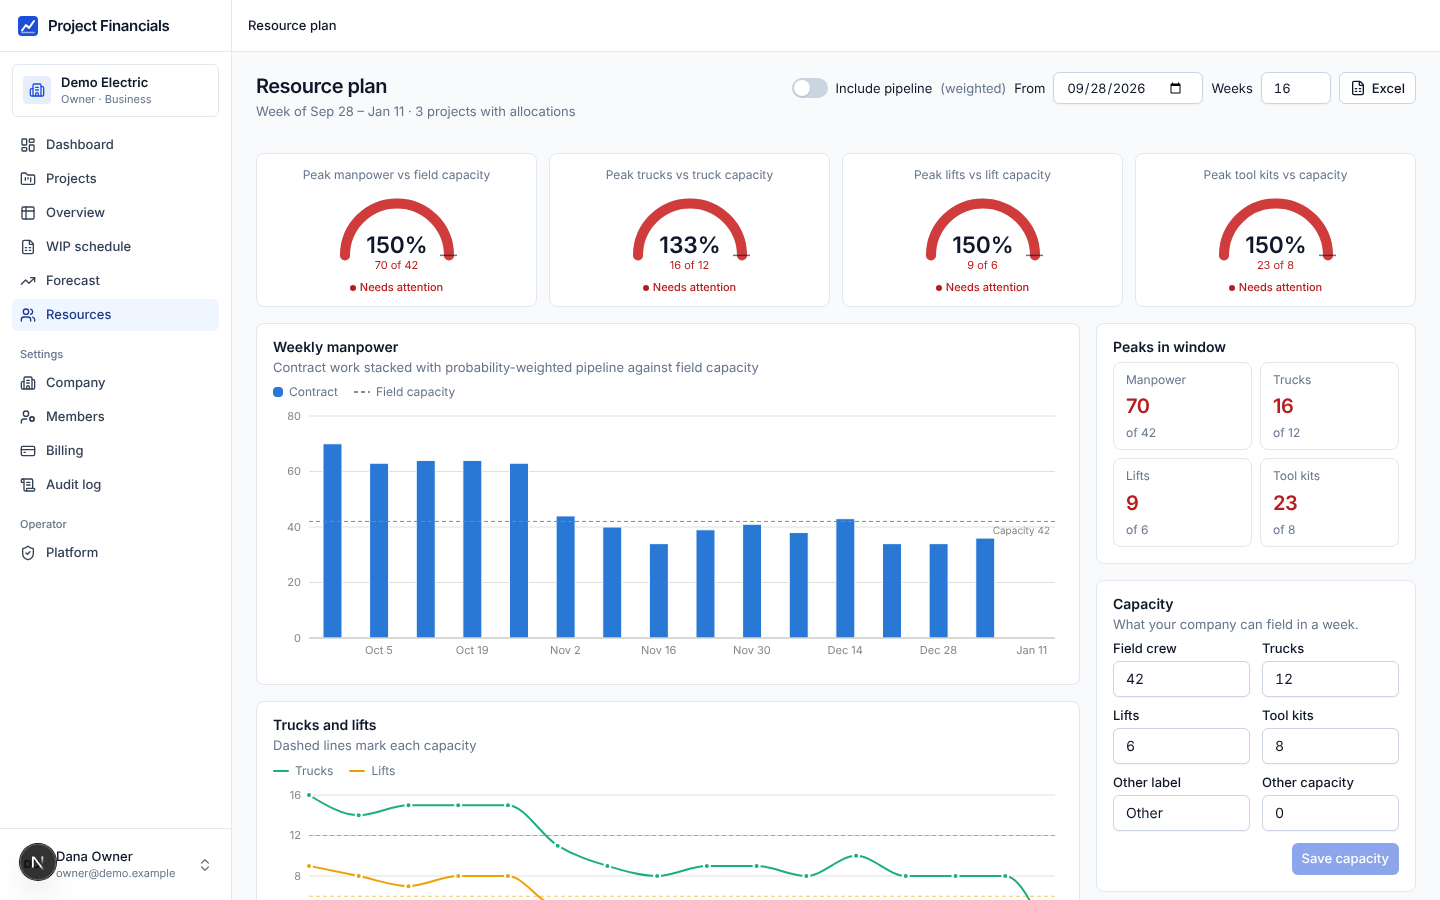
Resource planning: people, trucks, lifts and tool kits by week
Each project gets a weekly grid of what it needs. The company sets what it can field. The planner stacks awarded work, adds pipeline weighted by probability, and shows the weeks you are over in red, for manpower and for each equipment type separately.
- Peaks in the window against each capacity
- Per-project grids editable by the PM
- Excel export of the whole plan
Roles and per-project access
Owners handle billing. Admins manage members. PMs run projects and see the whole company. Field users and viewers see only the projects you assign, so a foreman can enter costs on their job without seeing another PM's margin.
- Invitations by email, roles changed any time
- A PM's own projects filter
- Audit log of every change on Business
| Owner | Admin | PM | Field | Viewer | |
|---|---|---|---|---|---|
| Billing | ✓ | — | — | — | — |
| Members and access | ✓ | ✓ | — | — | — |
| Projects and settings | ✓ | ✓ | ✓ | — | — |
| Draws, COs, costs, forecast | ✓ | ✓ | ✓ | assigned | read |
| WIP and dashboard | ✓ | ✓ | ✓ | own rows | own rows |
| Exports | ✓ | ✓ | ✓ | own | own |
Excel and PDF out, Excel in
Every table has an export button. The WIP schedule, cash flow and resource plan come out as real spreadsheets with numeric cells, not pictures of tables. Projects and cost grids come in from Excel. And the whole company exports as a zip, any time, on any plan.
Which plan has which feature is laid out on the pricing page. The trial runs on Professional, so you can see forecasting and the full WIP schedule with your own numbers.
Produce your first WIP schedule this week.
Fourteen days, full Professional features, no credit card. Import your projects from Excel, enter the draws and costs you already have, and hand your bonding agent a schedule you can stand behind.